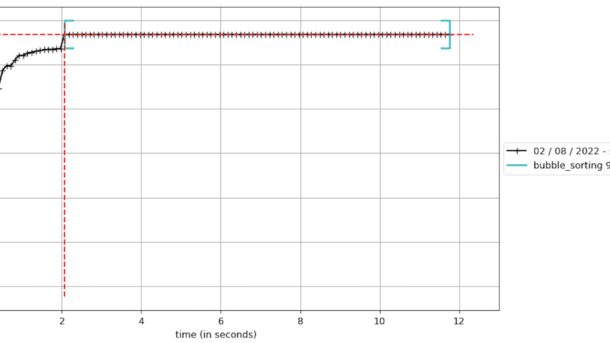
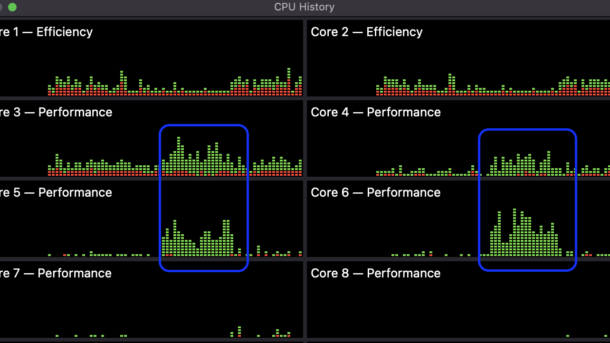
Table of Contents memory_profiler PySpy DISassembling Final Recommendations memory_profiler Similar to line_profiler, memory_profiler provides detailed memory usage measurements, with the aim of efficiently reducing memory consumption and optimizing memory usage to improve application performance.. ⚠️ Before starting using this tool, it is important to mention the impact on the execution...
Continue reading...Tools
Python Profiling – cProfile and line_profiler Tools (Part 2)
Table of Contents cProfile SnakeViz, for cProfile insights Line-by-line Profiling About @profile decorator Other useful tools gprof2dot Pyinstrument Conclusion Appendix Install with pip or conda cProfile The Python standard library includes the profile tool by default; however, it additionally includes cProfile, which is an optimization of profile written in C....
Continue reading...Python Profiling – Time Profiling (Part 1)
Table of Contents Introduction Time Profiling Tools functools.wraps timeit module time / gtime Conclusion Introduction Many times, the code we write requires optimizations, and profiling helps us find the problematic sections of code, investing the least amount of work on fixing the issue, while aiming for the goal of gaining...
Continue reading...Installing Redis on Azure Ubuntu VM
In one of my latest developments I needed to have a local Redis for caching requirements. I feel comfortable on terminal/command line, so it wasn’t hard to have an Ubuntu VM on VirtualBox, and it is very helpful to have it running on cloud if you need a testing site;...
Continue reading...Installing SQL Server for Linux on Docker Container
It is very common requiring MS SqlServer if you are developing ASP.NET web applications; because of this, having a local Sql Server is a great plus if you are developing web apps on ASP.NET Core on Mac, or Linux. One of the things to take in consideration is that we can...
Continue reading...