Table of Contents
cProfile
The Python standard library includes the profile tool by default; however, it additionally includes cProfile, which is an optimization of profile written in C.
A good engineering practice, prior to profiling, is to generate a hypothesis about the speed and performance of the components of the application under evaluation. This is useful, as it helps us identify potential bottlenecks, and allows us to support our findings with evidence.
We are going to use the same sorting algorithm that we used in the previous post (Time Profiling), and cProfile to observe the performance:
import numpy as np


def bubble_sorting(array):
    n = len(array)

    for i in range(n):
        sorted_item = True

        for j in range(n - i - 1):
            if array[j] > array[j + 1]:
                array[j], array[j + 1] = array[j + 1], array[j]
                sorted_item = False

        if sorted_item:
            break

    return array


work_array = np.random.randint(1, 100000, size=10000)
bubble_sorting(work_array)
alexis@MacBook-Pro % python -m cProfile -s cumulative main.py
         74777 function calls (72805 primitive calls) in 10.061 seconds

   Ordered by: cumulative time

   ncalls  tottime  percall  cumtime  percall filename:lineno(function)
    110/1    0.000    0.000   10.062   10.062 {built-in method builtins.exec}
        1    0.000    0.000   10.061   10.061 main.py:1(<module>)
        1    9.959    9.959    9.959    9.959 main.py:4(bubble_sorting)
       13    0.000    0.000    0.213    0.016 __init__.py:1(<module>)
    149/1    0.000    0.000    0.102    0.102 <frozen importlib._bootstrap>:1002(_find_and_load)
    149/1    0.000    0.000    0.102    0.102 <frozen importlib._bootstrap>:967(_find_and_load_unlocked)
    138/1    0.000    0.000    0.102    0.102 <frozen importlib._bootstrap>:659(_load_unlocked)
    109/1    0.000    0.000    0.102    0.102 <frozen importlib._bootstrap_external>:844(exec_module)
    216/1    0.000    0.000    0.102    0.102 <frozen importlib._bootstrap>:220(_call_with_frames_removed)
   179/15    0.000    0.000    0.095    0.006 <frozen importlib._bootstrap>:1033(_handle_fromlist)
    362/8    0.000    0.000    0.095    0.012 {built-in method builtins.__import__}
  138/135    0.000    0.000    0.042    0.000 <frozen importlib._bootstrap>:558(module_from_spec)
    28/26    0.000    0.000    0.040    0.002 <frozen importlib._bootstrap_external>:1171(create_module)
    28/26    0.039    0.001    0.040    0.002 {built-in method _imp.create_dynamic}
      109    0.000    0.000    0.027    0.000 <frozen importlib._bootstrap_external>:916(get_code)
        1    0.000    0.000    0.023    0.023 _pickle.py:1(<module>)
        1    0.000    0.000    0.022    0.022 multiarray.py:1(<module>)
        1    0.000    0.000    0.022    0.022 overrides.py:1(<module>)
  ...
The -s cumulative parameter sorts function calls by elapsed execution time, and gives us an idea of where the longest execution time occurred. We can see that the total execution time is similar to the times obtained when we measured just the elapsed execution time, which gives us a good indication of the optimization level of cProfile.
Line [9] tells us that the bubble_sorting method is called only once, and between lines [11] and [20] we see that most calls occur where the sort is performed, moving and freezing data in memory. These metrics can give us a read on where most of the processing of the function is done, since figuring out what’s happening line by line is very tricky with cProfile.
These results can be exported to a binary file for further analysis, using the Python pstats library; these statistics basically contain the information obtained by the terminal:
alexis@MacBook-Pro % python -m cProfile -o statistics.stats main.py
import pstats

# Displays the results, sorted by cumulative elapsed time
p = pstats.Stats('statistics.stats')
p.sort_stats('cumulative')
p.print_stats()
We can display the information of the calling functions, using the p.print_callers() method:
Ordered by: cumulative time

Function                                                  was called by...
                                                        ncalls  tottime  cumtime
{built-in method builtins.exec}                    <-   109/1    0.000    0.116  <frozen importlib._bootstrap>:220(_call_with_frames_removed)
main.py:1(<module>)                                <-       1    0.000   10.023  {built-in method builtins.exec}
main.py:4(bubble_sorting)                          <-       1    9.905    9.905  main.py:1(<module>)
<frozen importlib._bootstrap>:1002(_find_and_load) <-       1    0.000    0.002  /<base_dir>/base64.py:3(<module>)
                                                            1    0.000    0.000  /<base_dir>/bisect.py:1(<module>)
                                                            2    0.000    0.008  /<base_dir>/ctypes/__init__.py:1(<module>)
                                                            2    0.000    0.001  /<base_dir>/datetime.py:1(<module>)
                                                            1    0.000    0.001  /<base_dir>/hashlib.py:82(__get_builtin_constructor)
                                                            2    0.000    0.007  /<base_dir>/hmac.py:1(<module>)
                                                            2    0.000    0.003  /<base_dir>/json/__init__.py:1(<module>)
                                                            1    0.000    0.001  /<base_dir>/json/scanner.py:1(<module>)
                                                            4    0.000    0.000  /<base_dir>/ntpath.py:2(<module>)
                                                            3    0.000    0.002  /<base_dir>/pathlib.py:1(<module>)
                                                            4    0.000    0.002  /<base_dir>/pickle.py:1(<module>)
                                                            1    0.000    0.005  /<base_dir>/platform.py:3(<module>)
                                                            3    0.000    0.002  /<base_dir>/random.py:1(<module>)
                                                            3    0.000    0.011  /<base_dir>/secrets.py:1(<module>)
                                                            2    0.000    0.001  /<base_dir>/site-packages/numpy/__init__.py:1(<module>)
...
Or the p.print_callees() option to show which functions call for other functions:
Ordered by: cumulative time

Function                                  called...
                                      ncalls  tottime  cumtime
{built-in method builtins.exec}  ->       1    0.000    0.000  /<base_dir>/__future__.py:1(<module>)
                                          1    0.000    0.000  /<base_dir>/_compat_pickle.py:9(<module>)
...
                                          1    0.000    0.000  /<base_dir>/urllib/parse.py:1(<module>)
                                          1    0.000   10.023  main.py:1(<module>)
main.py:1(<module>)              ->       1    0.000    0.117  <frozen importlib._bootstrap>:1002(_find_and_load)
                                           1    9.905    9.905  main.py:4(bubble_sorting)
                                           1    0.000    0.001  {method 'randint' of 'numpy.random.mtrand.RandomState' objects}
 main.py:4(bubble_sorting)        ->       1    0.000    0.000  {built-in method builtins.len}
 <frozen importlib._bootstrap>:1002(_find_and_load)  ->     149    0.000    0.000  <frozen importlib._bootstrap>:152(__init__)
                                         149    0.000    0.001  <frozen importlib._bootstrap>:156(__enter__)
                                         149    0.000    0.000  <frozen importlib._bootstrap>:160(__exit__)
                                         148    0.000    0.000  <frozen importlib._bootstrap>:185(cb)
                                       149/1    0.000    0.117  <frozen importlib._bootstrap>:967(_find_and_load_unlocked)
                                         149    0.000    0.000  {method 'get' of 'dict' objects}
 <frozen importlib._bootstrap>:967(_find_and_load_unlocked)  ->     4/1    0.000    0.007  <frozen importlib._bootstrap>:220(_call_with_frames_removed)
                                       138/1    0.000    0.117  <frozen importlib._bootstrap>:659(_load_unlocked)
...
The information provided by cProfile is extensive and a complete visualization of the information will be necessary in order to obtain the greatest benefit from the tool. Something that can help us in the visualization is to use the SnakeViz module, which diagrams the information obtained by cProfile.
SnakeViz, for cProfile insights
According to the description found on the website:
SnakeViz is a browser based graphical viewer for the output of Python’s cProfile module and an alternative to using the standard library pstats module…
SnakeViz Website
Using the statistics file obtained with cProfile, we can visualize the results of the profiling:
snakeviz statistics.stats
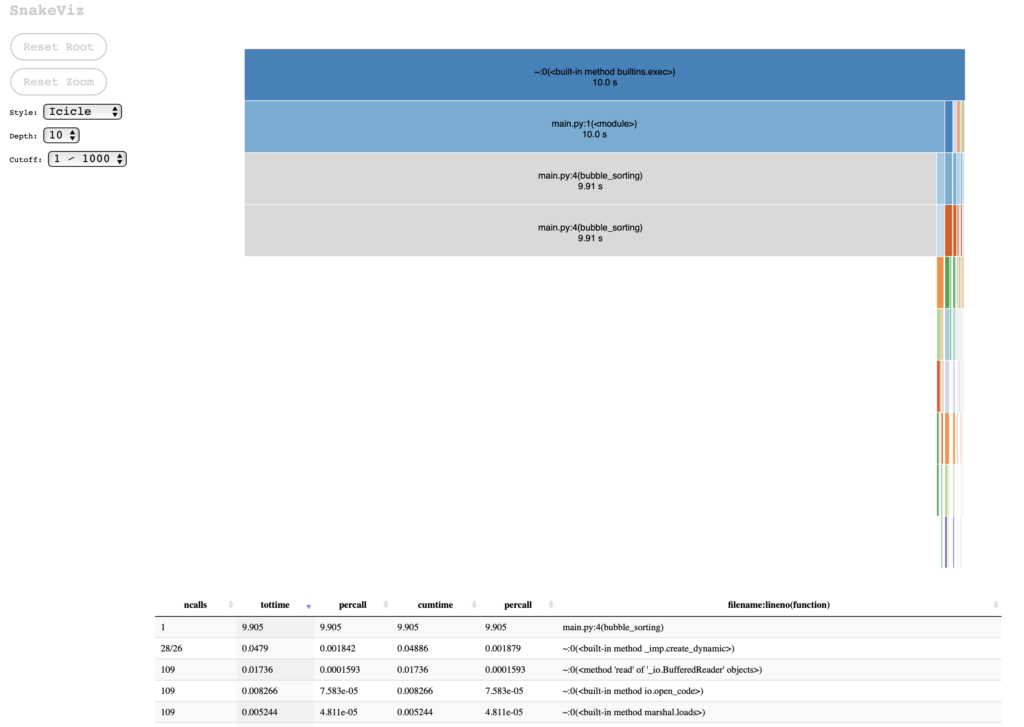
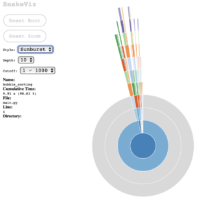
If we choose the Sunburst chart style, I find it clearer that most of the processing is done from the main call to bubble_sorting (which is obvious, considering the simplicity of the test case):
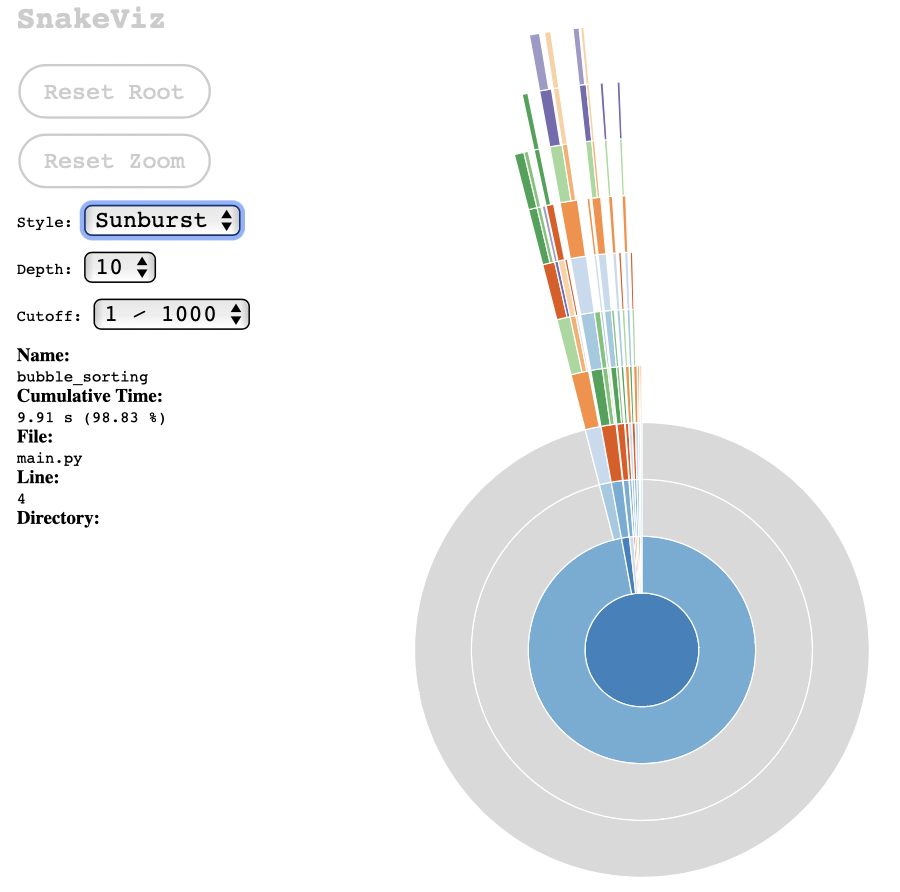
These graphs are useful to communicate to others about the results of the execution of the module under test, and it helps to visually identify which part of the process consumes the most processing.
Line-by-line Profiling
line_profiler is a great tool for identifying causes of poor code performance as it evaluates Python functions line by line, and this is where using cProfile should lead us: to evaluate sections of problematic code and that will be the ideal point to use line_profiler.
TIP📝 -> It is important to keep track of code changes and profiling results as some changes may cause drawbacks in other sections.
line_profiler includes two utilities:
- The
@profiledecorator, which indicates the functions to be profiled. kernprofis responsible for executing and recording the evaluation metrics and statistics.
Optionally, kernprof has the -v (verbose) parameter which, when included, displays the results on termination; and when omitted it generates a file with extension .lprof that can be analyzed later using line_profiler.
For example:
import numpy as np


# WARNING DEVS: this decorator doesn't need to import anything
# this is intended for kernprof usage only
# be prepared with some coffee to wait until the profiling finishes
@profile
def bubble_sorting(array):
    n = len(array)

    for i in range(n):
        sorted_item = True

        for j in range(n - i - 1):
            if array[j] > array[j + 1]:
                array[j], array[j + 1] = array[j + 1], array[j]
                sorted_item = False

        if sorted_item:
            break

    return array


work_array = np.random.randint(1, 100000, size=10000)
bubble_sorting(work_array)
alexis@MacBook-Pro % kernprof -l -v main.py
Wrote profile results to main.py.lprof
Timer unit: 1e-06 s

Total time: 68.9938 s
File: main.py
Function: bubble_sorting at line 4

Line #      Hits         Time  Per Hit   % Time  Line Contents
==============================================================
     4                                           @profile
     5                                           def bubble_sorting(array):
     6         1          4.7      4.7      0.0      n = len(array)
     7
     8      9863       3127.6      0.3      0.0      for i in range(n):
     9      9863       3076.8      0.3      0.0          sorted_item = True
    10
    11  49995547   15022385.0      0.3     21.8          for j in range(n - i - 1):
    12  49985684   27385581.9      0.5     39.7              if array[j] > array[j + 1]:
    13  24989733   18838493.1      0.8     27.3                  array[j], array[j + 1] = array[j + 1], array[j]
    14  24989733    7737957.2      0.3     11.2                  sorted_item = False
    15
    16      9863       3134.5      0.3      0.0          if sorted_item:
    17         1          0.3      0.3      0.0              break
    18
    19         1          6.1      6.1      0.0      return array
This is much more descriptive than the results obtained from cProfile, but the idea is to use cProfile to identify which functions you should evaluate with line_profiler. Additionally, we can learn about the cost of operations and improve our programming skills.
About @profile decorator
Perhaps you were able to see the comment close the bubble_sorting method definition:
# WARNING DEVS: this decorator doesn't need to import anything
# this is intended for kernprof usage only
# be prepared with some coffee to wait until the profiling finishes
Adding the @profile decorator will work when we are using line_profiler (or memory_profiler), but if you try to run, for example, unit tests, it will fail with the following message:
Traceback (most recent call last):
  File "/Users/alexis/PythonProfiling/main.py", line 3, in <module>
    @profile
NameError: name 'profile' is not defined

Process finished with exit code 1
You don’t want broken code into your Git repository, so you can add the following code to avoid the error message on runtime:
import numpy as np

if 'line_profiler' not in dir() and 'profile' not in dir():
    def profile(func):
        return func


@profile
def bubble_sorting(array):
    n = len(array)

    for i in range(n):
        sorted_item = True

        for j in range(n - i - 1):
            if array[j] > array[j + 1]:
                array[j], array[j + 1] = array[j + 1], array[j]
                sorted_item = False

        if sorted_item:
            break

    return array


work_array = np.random.randint(1, 100000, size=1000)
bubble_sorting(work_array)
Other useful tools
gprof2dot
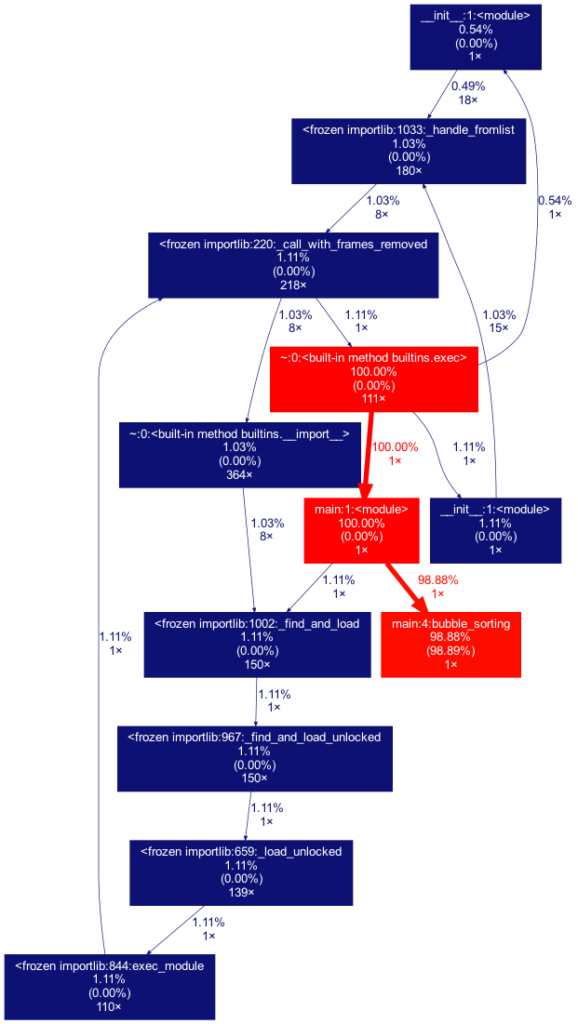
Another useful tool is gprof2dot, which allows you to view the statistics obtained with cProfile. Requires prior installation of the Graphviz app. gprof2dot contains the dot command, and it is used as follows:
alexis@MacBook-Pro % gprof2dot -f pstats statistics.stats | dot -Tpng -o output.png
This pipeline transfers the analysis performed by gprof2dot to the Graphviz dot command, and generates the following graph:
Pyinstrument
This tool complements cProfile by adding some missing functionalities like more visualization options and integration with web frameworks like Django, Flask or FastAPI, which I consider is a great help for profiling Web applications and REST APIs.
The most basic way to use Pyinstrument, is just calling the command, followed by the script to be evaluated:
alexis@MacBook-Pro % pyinstrument main.py

  _     ._   __/__   _ _  _  _ _/_   Recorded: 07:50:33  Samples:  73
 /_//_/// /_\ / //_// / //_'/ //     Duration: 9.885     CPU time: 10.188
/   _/                      v4.2.0

Program: main.py

9.885 <module>  <string>:1
   [4 frames hidden]  <string>, runpy
      9.885 _run_code  runpy.py:64
      └─ 9.885 <module>  main.py:1
         ├─ 9.772 bubble_sorting  main.py:4
         └─ 0.112 <module>  numpy/__init__.py:1
               [193 frames hidden]  numpy, pickle, <built-in>, pathlib, a...
For more details on how to integrate Pyinstrument into the related frameworks, we can click the following links:
- Profile code in Jupyter/IPython
- Profile a web request in Django
- Profile a web request in Flask
- Profile a web request in FastAPI
Conclusion
cProfile and line_profiler offer us a great detail of information about the execution of the sections of code that we want to evaluate. On our part, it is important to understand the methodology to obtain the best results of using these tools.
In each execution cycle and code modification we can formulate hypotheses about what we expect from the change, and evaluate its performance. Logging the results will be important to understand which code changes positively impacted performance.
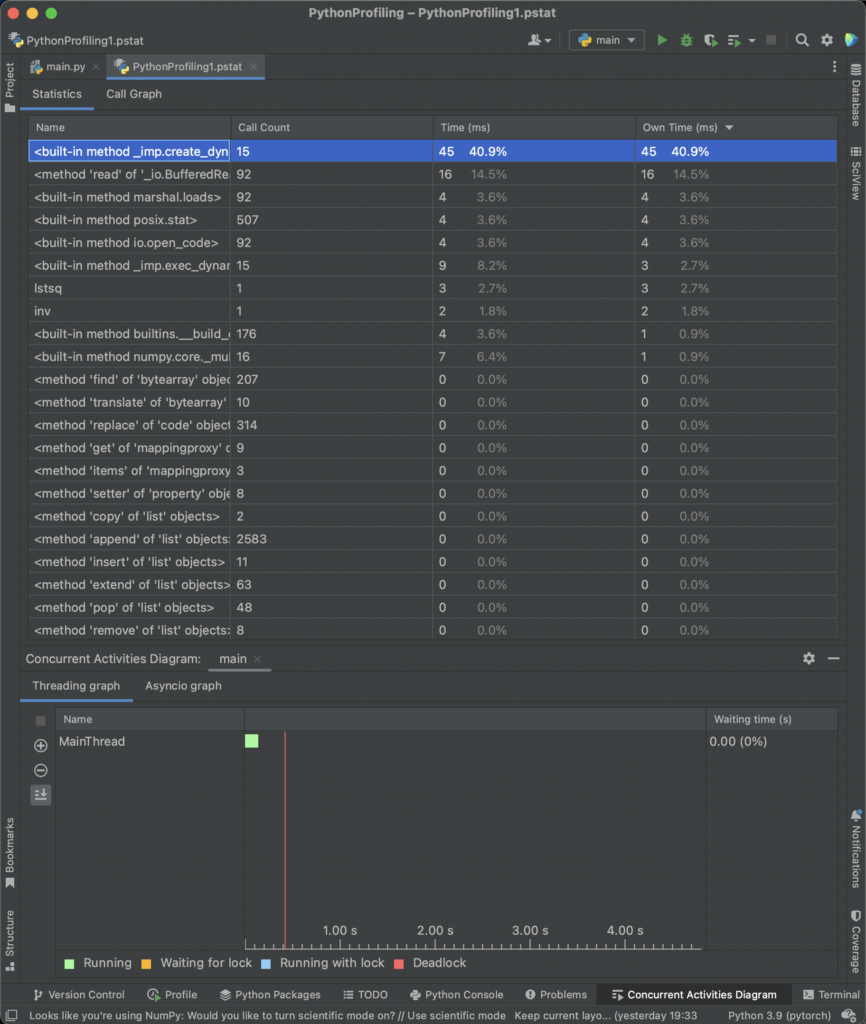
Additionaly, cProfile is the default option in PyCharm, which makes a kind of “default” option for many developers.
Appendix
Install with pip or conda
# PIP
pip install snakeviz
pip install line_profiler[ipython]
pip install gprof2dot
pip install pyinstrument

# Conda
conda install -c anaconda snakeviz
conda install -c conda-forge line_profiler
conda install -c conda-forge gprof2dot
conda install -c conda-forge pyinstrument
If you think this content was helpful, consider buy me a cup of coffee. 😉 ☕👉
